A preview of the main points of the new industry analysis prepared by Luiss University in Rome
by Ernesto Cassetta, Umberto Monarca, Davide Quaglione e Cesare Pozzi
The framework of the ongoing structural changes in the industry of raw aluminium and semis in the European Union analysed considering the protectionist drives and the Community’s aims of relaunching the manufacturing system and fighting climate change. An exclusive preview for A&L of the second study which Rome’s LUISS University dedicated to the analysis of the main dynamics of the industry so as to understand the trends and future outlook and to provide decision makers with useful information to define policies capable of supporting and relaunching the European Union’s aluminium industry and especially the downstream segment which is its heart in terms of revenues, added value and employment. This first article, dedicated to an update regarding the light metal industry, examined globally and in European Union countries, will be followed in the next issues of this magazine by articles relative to the analysis of downstream production, which depends largely on a reliable and competitive supply of raw aluminium and on long-term relationships with the main manufacturers.
INTRODUCTION
During the past few decades, the global aluminium industry underwent great structural and technological changes. In Europe (therefore including European Union and EFTA countries), the aluminium industry has traditionally been considered as strategic, with annual revenues which during the past few years have been estimated at around 40 billion euros and with about 250,000 employees. Most European companies now work in the downstream phases of the value chain of the production of aluminium semis for the automotive, transportation, aerospace, building and construction, durable products and packaging industries, while the number of companies operating in the upstream phases of alumina refining and primary production of raw aluminium progressively diminished over time. Based on European Aluminium data referring to 2015, roughly 60% of overall annual revenues, 90% of total employment and 65% of the R&D investments of the entire European aluminium industry may be traces back to the aluminium downstream. The relative weight of downstream is even larger in EU countries considering that about half of the alumina refining and primary metal production capacity is found in EFTA countries, especially Norway and Iceland. During the next few years, it is envisaged that the demand for raw aluminium will grow at an annual rate of 3% globally and 1.7% in the EU. As a consequence, while the scarcity of raw aluminium in the EU is destined to grow even worse, manufacturers of aluminium semis will be increasingly vulnerable to a growing international competition coming especially from China. Considering the framework which has just been outlined, it may be considered useful to start reflecting on the structural evolution of the aluminium industry in the EU focusing on the phases of semis production (and particularly on the production of extrusions, rolled products and foundry castings), where the EU still has a relevant presence and holds leading positions globally. From this standpoint, the study by the “Fabio Gobbo” Financial and Industrial Research Group of Rome’s LUISS Guido Carli intends providing useful elements for judgement to public decision makers. Specific weight was attributed to the evaluation of the commercial policies of the EU and to the impact of import tariffs on the evolution of the industry’s structure and on the manufacturers of semis, especially those who are not vertically integrated, even considering the modified global scenario.
THE ALUMINIUM INDUSTRY: STRUCTURAL EVOLUTION AND RECENT DYNAMICS
Bauxite extraction
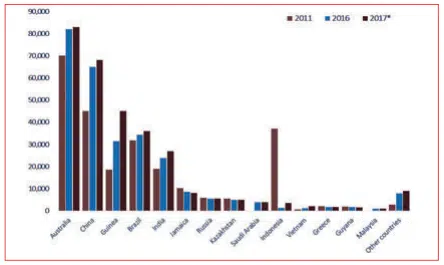
Bauxite resources are resent in many areas of the world, between 55 and 75 billion tons were estimated in 2017. Bauxite is more abundant in tropical regions in Africa (32%), Oceania (23%), South America and the Caribbean (21%), Asia (18%). The most important reserves are found in Guinea (25%), Australia (20%), Vietnam (12%), Brazil (9%) and Jamaica (7%). Global bauxite production grew from 250 million tons in 2011 to 300 million tons in 2017. Worldwide production of bauxite in 2011 and 2016-17 is reported in Figure 1. The largest producing countries globally are Australia (with a share of the global output equal to 28% in 2017), China (23%), Guinea (15%), Brazil (12%) and India (9%). Greece is the only EU country with a significant bauxite production (1.8 million tons in 2017). Altogether, it is estimated that roughly 0,7% of the world’s bauxite was produced in the EU in 2016.
Alumina refining
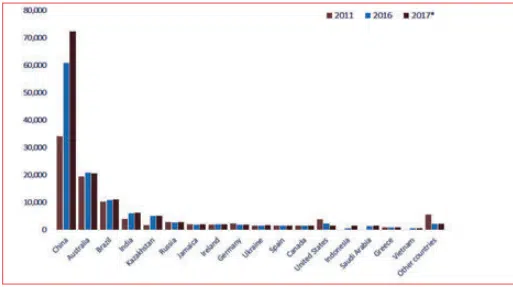
In 2017, the main global producer of aluminium was China with over 70 million tons (equal to 53% of the world’s output), followed by Australia (20%), Brazil (10%), India (6%) and Kazakhstan (4,6%). The global production of alumina in 2011 and 2016-2017 is shown in Figure 2. Altogether, the first five countries produce just under 85% of the world’s alumina. The EU imports the best part of alumina required for the internal production of raw aluminium. It should be considered that the main producing countries in the EU (Ireland, Germany, Spain and Greece) represented about 4.6% of the global production of alumina in 2017. Alumina refining production capacity is also present in France and Romania.
Primary and secondary production of raw aluminium
In 2017, the primary production of raw aluminium in the world added up to 63.4 million tons, in 2000 it was just over 24.5 million tons (as shown in Table 1).
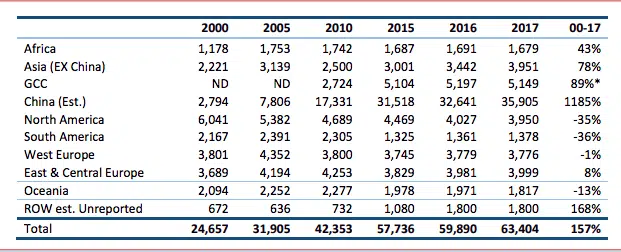
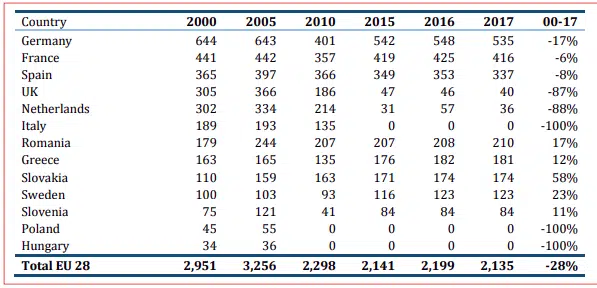
The location of the primary production of raw aluminium changed drastically during the past 20 years, with sharp increase of China’s clout (now representing roughly 57% of the total production), the marked retreat of North America and Europe and the newly acquired importance of the Gulf States. The market share of European countries in the production of primary aluminium went from 30% in 2000 to roughly 12% in 2017, with overall production values of 7.8 million tons in 2017. As shown by Table 2, only 2.1 million tons have been produced in the EU, or about 3.4% of the global production. About 60% of this production may be referred to just three countries, Germany, France and Spain. In the 2000- 2017 period, the EU lost more than one fourth of its aluminium production. The total production capacity dropped by the same percentage in the 2008-2016 period alone. Such countries as Italy, the UK, the Netherlands, Poland and Hungary drastically reduced or ceased primary aluminium production.
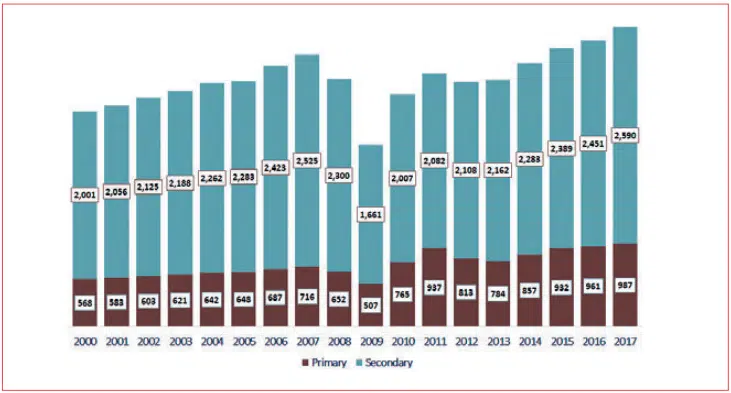
The raw aluminium production industry remains highly concentrated, both at global and European levels. In 2017, the first 10 production companies represented 53% of the total production. The Chinese Hongqiao Group is the greatest producer worldwide with an annual volume of 7.5 million tons in 2017. The Hongqiao Group and other large Chinese companies (such as Chalco, Shandong Xinfa, SPIC and East Hope) further increased their production during the past year in spite of their having given up on numerous projects in order to comply with the aluminium industry reformation demanded by the Chinese Government. The first non-Chinese companies are UC Rusal, the largest aluminium producing company in the Russian Federation, with a total aluminium production of 3.7 million tons in 2017; during the same year Norwegian concern Norsk Hydro was the largest aluminium manufacturer in Western Europe with 2.1 million tons. Norsk Hydro and Alcoa Corp. are accountable for about 46% of the production capacity in Europe, percentage destined to increase with the possible acquisition by Norsk Hydro of Icelandic Aluminium Company (ISAL)*. In 2017, the production of raw aluminium from scrap and recycled metal in the EU was estimated at around 3.2 million tons (see Figure 3), lower than pre-crisis levels )about 3.6 million tons in 2007).
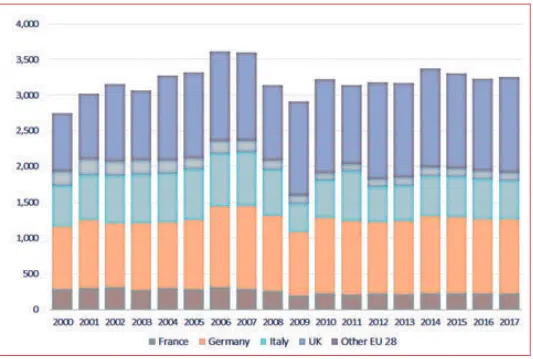
It should be considered that in 2015 secondary production of aluminium worldwide added up to roughly 27 million tons. In spite of the fact that it is considered essential on account of its lower energy demands and environmental impact, as well as because of the size of the consumption market, secondary production in Europe only grew to a limited extent in the 2000-2017 period. According to European Aluminium (2015), there are about 220 secondary metal production plants in Europe, many being small and medium enterprises (SMEs) with many family-run businesses. In terms of geographical distribution of production, Germany and Italy are the two countries with the greatest share. In 2016, both countries together produced slightly less than 50% of the secondary aluminium in EU28.
Semi-finished products
Raw primary and secondary metal is used, mostly as aluminium ingots or bars, slabs and billets, by downstream companies to produce semis meant for the needs of such important final use sectors as automotive, transportation, building and constructions, mechanics, furniture etc. Focusing on extrusions, rolled products and foundry castings, the global production of aluminium semis shown in Table 3 added up to over 77 million tons in 2017, with an increase of 33% in the 2012- 2017 period.
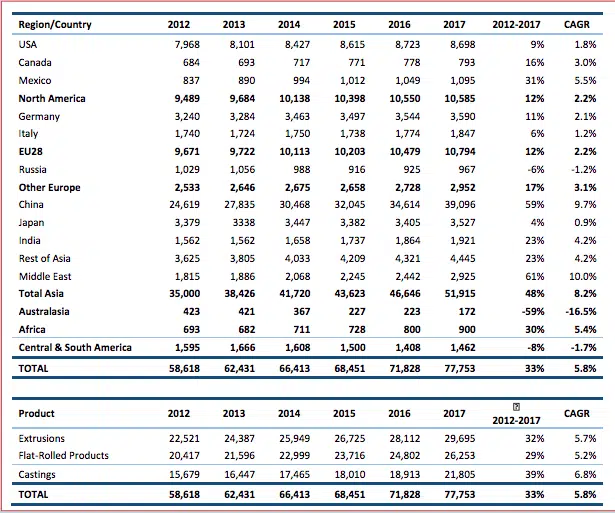
China, the USA and the EU are still the main production areas for aluminium semis. However, the annual growth rate remained brisk only in China (9.7% in the 2012-2017 period), while the increase was more moderate in the USA (1.8%) and in the EU (2.2%). The growth in production was also fast in the Middle East countries (10.0%) while Australasian and Central and Southern American regions experienced a decrease (-16,5% and -1,7% respectively). The increase in volumes produced was basically similar in all three categories of semis being examined. In 2017, aluminium extrusions made up the largest share (over 38%) of the global production of aluminium semis, followed by flat rolled products (just under 34%). Foundry castings experienced the greatest increase, with production volumes up by 39% in the 2012-2017 period. Germany, Italy and France are the main producers of aluminium semis in the EU, a they represent about 60% of the total production in 2017 (see Table 4).
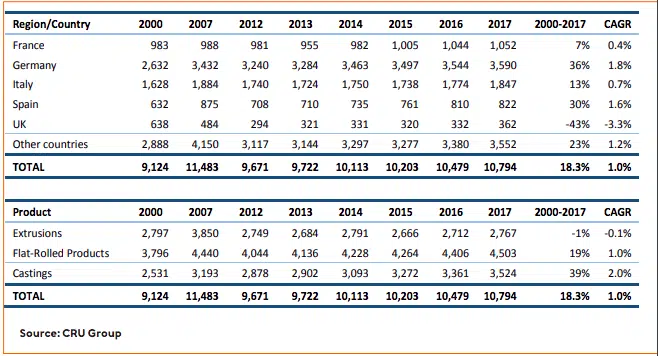
During the same year, unlike in France and Germany, the production of semis in Italy was still below pre-crisis levels. In the 2000-2017 period, and especially after the economic downturn, Germany further strengthened its leadership and now covers about one third of the EU’s total production (29% in 2000). On the contrary, the United Kingdom experienced a sizeable decrease in its production volumes (-43 %) and its market share in the EU diminished as a consequence (from 7% to 3%). In the 2000-2017 period, the increase in the production of aluminium semis in the EU was mainly due to foundry castings (+39%) and rolled products (+19%). The current production volumes of aluminium extrusions (about 2.7 million tons) not only failed to recuperate the pre-crisis levels, but they are actually lower than in 2000. In 2017, globally, semis produced by downstream segments of the aluminium industry have been mainly used by the transportation industry (26%), building and constructions (26%), followed by packaging (15%), electrical appliances (14%), machines and tools (9%) and durable consumer goods (5%). Regarding Europe, transportation (42%) is the main segment of final users, followed by constructions (23%) and packaging (17%); altogether, these three segments make up over 80% of all aluminium products consumed in Europe in 2017.
Extrusions
Global production of aluminium extrusions, roughly 29.7 million tons in 2017, grew more than threefold with respect to the 2000 levels, largely because of the considerable increase in Chinese production (see Figure 4).
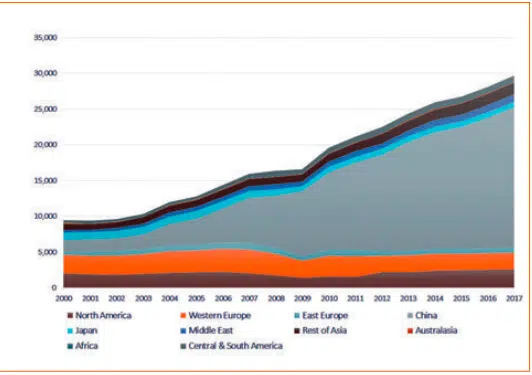
Aluminium extrusions made in China today represent two thirds of the global total, from 1.6 million tons in 2000 to 19.5 million tons in 2017. The growth in production has been remarkable even in Middle East countries, which increased their production threefold. More in general, the production of aluminium extrusions increased in all regions except Western Europe, Japan and Australasia. In the 2000-2017 period, extrusion productions in EU28 remained relatively stable, settling down at about 2.8 million tons in 2017, with an average decrease to 0.1% with respect to 2000. As a consequence, the share of the EU on the world’s production of aluminium extrusions drastically decreased, going from almost one third in the 2000-2003 period to 9% in 2017. Italy, the greatest producer in EU28 together with Germany, recorded a sharp decrease in production after 2007. In Germany, on the other hand, production of aluminium extrusions grew by 40% in the 2009- 2017 period alone. Almost one extruded product out of four is today produced in Germany. Regarding the type of raw aluminium used for extrusion billets, at EU level a ratio of primary billets/secondary billets of about 60/40 is estimated (source A&L).
Rolled products
As shown in Figure 5, the global production of rolled aluminium products more than doubled in the 2000-2017 period, from 12.9 to 26.2 million tons (+ 104%), with a compound annual growth rate of 4,3%.
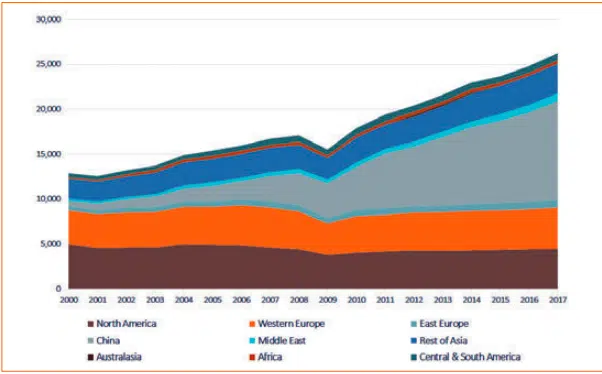
The production of rolled aluminium products grew in all regions, except North America (-11%). On the contrary, the production of rolled aluminium products in China went from 0.6 million tons in 2000 to 11.0 million tons in 2017. China today is home to about 42% of the global production of rolled aluminium products (with respect to 5 percent recorded in 2000). In the 2000-2017 period, the production of rolled products in EU28 increased by 19%, reaching about 4.5 million tons in 2017. This is a production level just above that recorded before the economic crisis. In spite of the increase in the total production, the share of EU28 countries in the global production of rolled products rapidly decreased (from 29% in 2000 to 17% in 2017). In 2017, about 68 percent of rolled products in the EU have been produced in just three countries (France, Germany and Italy). Germany alone represents 41% of the EU’s production, with many plants producing for the transportation industry (both for automotive and aerospace manufacturers) and for the building industry. Regarding the type of aluminium used for rolling slabs in the EU, it is estimated that the primary-to-secondary ratio is 50-50 (Figure 8).
Foundry castings
The global production of foundry castings in aluminium more than doubled during the 2000-2017 period, from 9.1 to 21.8 million tons (+140 percent). As for other semis, the best part of this growth is due to China, which increased its production of aluminium castings tenfold, from 0.8 to 8.5 million tons (see Figure 7).
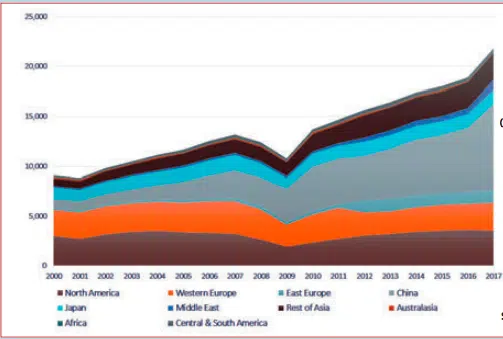
In 2017, China represented almost 39% of the global production of aluminium castings with respect to 9% recorded in 2000. Remarkable growth rates have also characterised the Middle East countries (+ 13.3% per year in the 2000-2017 period). On the contrary, Western Europe, North America and Japan have all shown a moderate growth with their total production of aluminium castings increasing by 6, 18 and 20 percent respectively in the 2000-2017 period. By concentrating on a shorter period, the production of cast products accelerated in Western Europe (+20 percent) and in North America (+16 percent), while it grew at a slower pace in Japan (+4 percent). In 2017, the production of aluminium castings in the EU added up to about 3,5 million tons. As shown in Table 6, the production level in the EU-28 increased by 39% in the 2000-2017 period, at a rate which was in any case considerably lower than the one characterising global production.
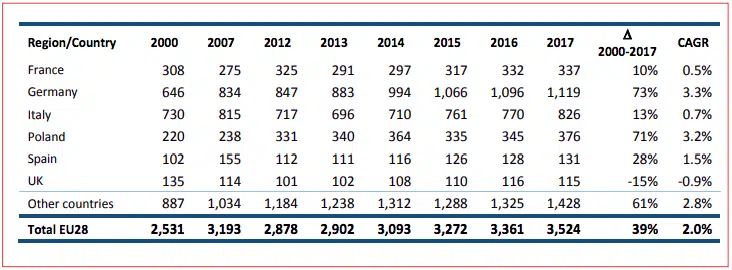
As a consequence, the share of EU countries in the global production of aluminium castings fell dramatically, from 28% in 2000 to 16% in 2017. In 2017, roughly 75% of aluminium castings in the EU 28 were made in just four countries (France, Germany, Italy and Poland). Germany, the main producer in the EU with about one third of the total production, further strengthened its position during the 2000-2017 period, increasing its production by 73%. Likewise, Poland recorded a similar growth (73%) and now represents the third country in the EU-28 in terms of production volumes. On average, about 75 percent of raw aluminium requested by EU foundries which produce aluminium castings derives from secondary production, The share of primary aluminium however increased during the past few years, driven by the growing use of structural castings with high strength requisites.
THE ALUMINIUM INDUSTRY IN THE EU: FOOD FOR THOUGHT
The structural changes described underline the need for a thorough reflection on the future of the aluminium industry in the EU. An evaluation of the community’s industrial policy, practically limited to trade policy, and a strategic analysis of the EU’s aluminium industry are the heart of the second part of the new study. The lack of raw materials and the limited presence of low-cost, environmentally sustainable energy sources led to a progressive deficit in the procurement of raw aluminium, in spite of a customs tariff policy which is aimed at promoting internal production. On the contrary, the trade policy ended up by favouring a vertical integration process and to hamper the only segment of the industry where the Eu still has leadership positions at a global level and a production organisation of enterprises which can generate income and create jobs all over the territory. The results obtained justify a real industrial policy strategy capable of restoring competitiveness to the European aluminium processing industry, starting from an elimination of tariffs on raw aluminium and making resources available which might be used to improve products and their environmental performances from the standpoint of a transition to a circular economy.
Article originally published by A&L and is reprinted with permission